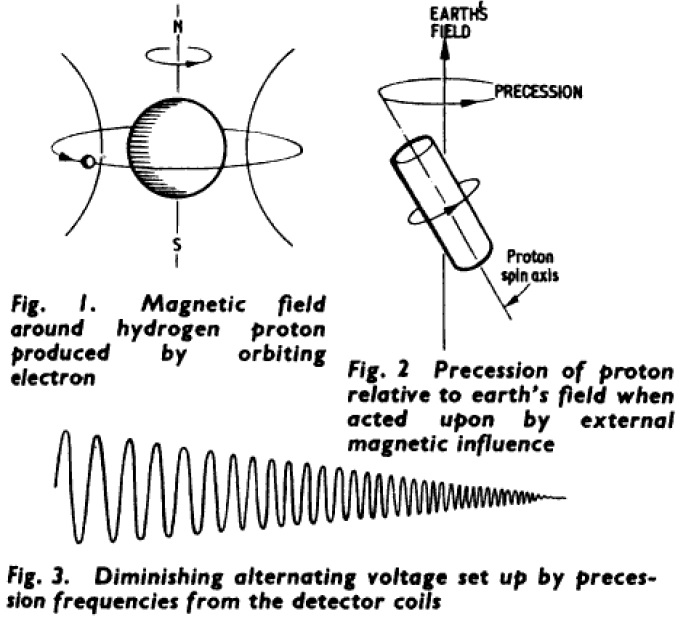
- Proton precession magnetometer is an interesting device that uses effects of quantum mechanics. Together with a relatively simple electronics one can get a precise scalar magnetometer… sounds simple but the practical realization can be a bit tricky. We played with this topic a bit, so below you can find some technical details which might be helpful…
“The story”
1) Once, doing some measurements-calibrations of our magnetometers, we realized that we would make use of another Overhauser scalar magnetometer (OVH)… for example to check the gradient of a local magnetic field. Well, there are some around so we could borrow it… But that is much less entertaining than to build one… A good starting point to build an OVH is to build a Proton Precession Magnetometer (PPM). The PPM is very old and simple so it should be “easy” to make it work…
2) One our colleague (Antonín Majer) offered his “one hundred percent sure working” homemade PPM sensor for the first testing.
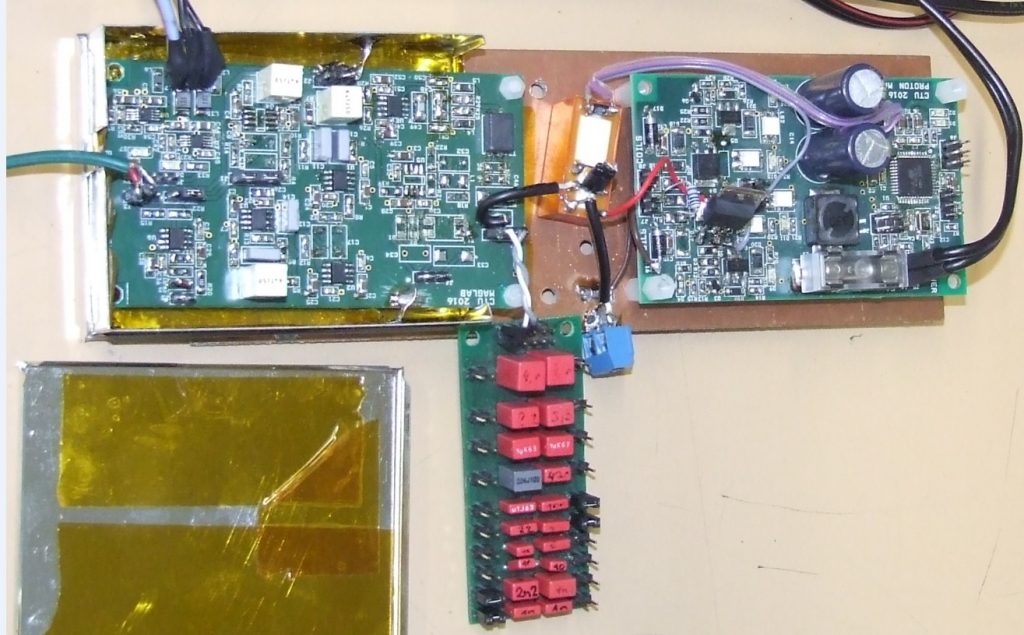
3) I studied some literature and available web sources and designed control-board and signal processing board to make it work…
4) We were not able to make it work together with the 100% sensor… did some modifications to the electronics, studied more, more testing…still nothing. On the internet one can find quite crazy notes about the necessity NOT to use any switched power supplies and other precautions which we were not able to meet (or willing to meet)…
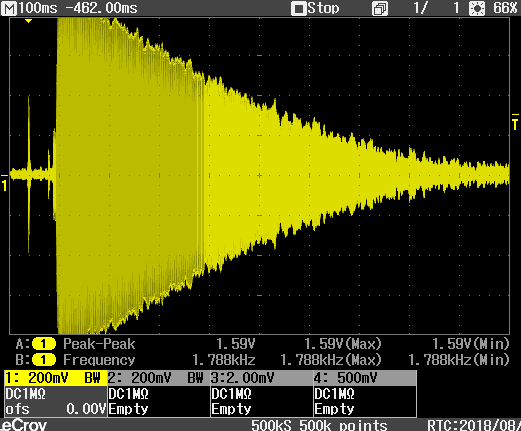
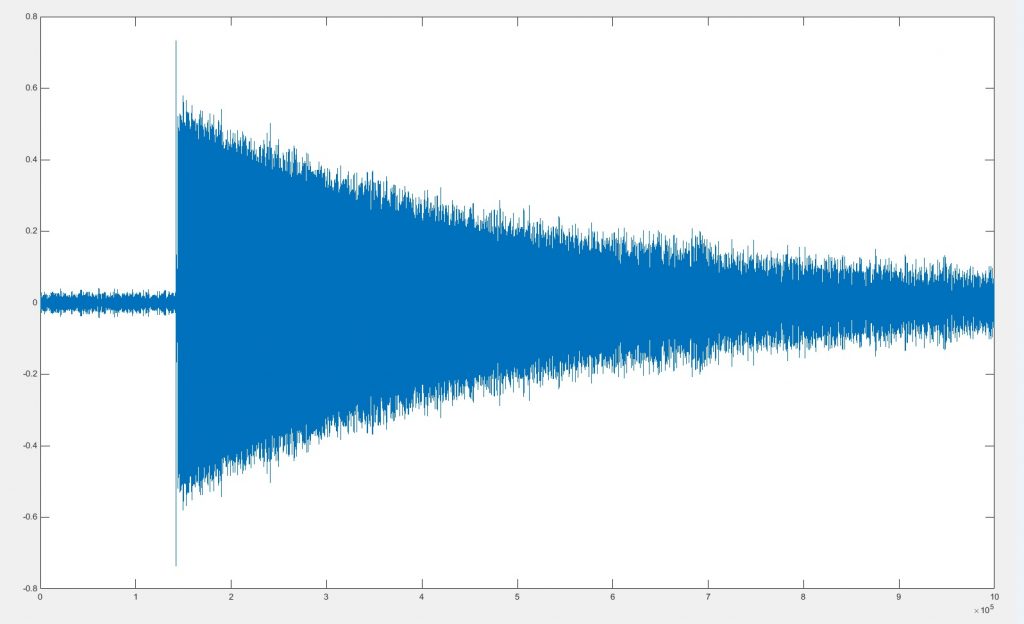
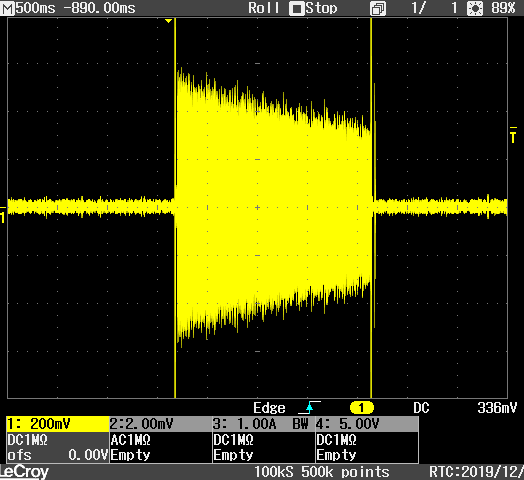
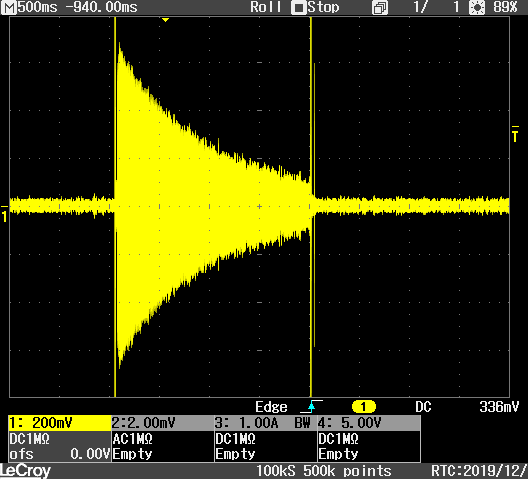
5) Fortunately we have one very old commercial PPM in our lab… the PM-2 from Geofyzika Brno… we took the sensor, connected to the electronics and miraculously saw the first Proton Precession Signal (PPS)… it was a poor one, with “beats” due to the poor homogeneity of the magnetic field in that area (just 1.5m out of a window of a family house). When tested at our magnetic calibration facility outside Prague (basically woods around and a non-magnetic building…) we got wonderful strong and clean PPS.
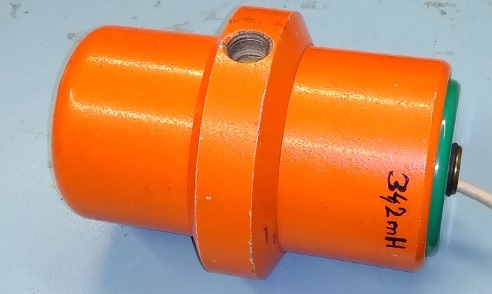
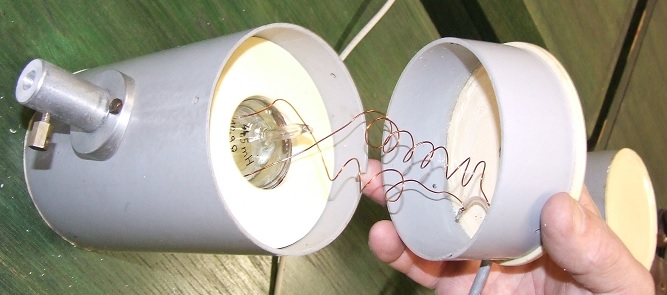
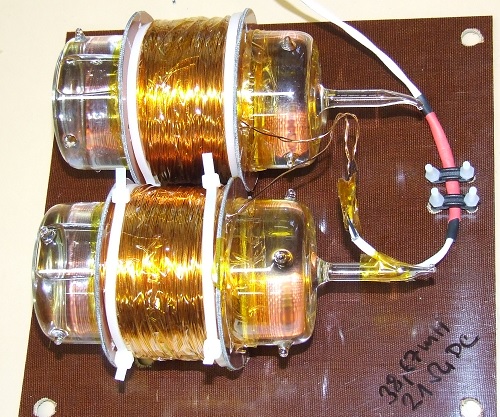
6) We designed our own sensor using two glass flask with Acetone inside (the sealed flasks with Acetone were manufactured by a colleague mentioned in point 2). It worked well, but it was very sensitive to the magnetic gradient…
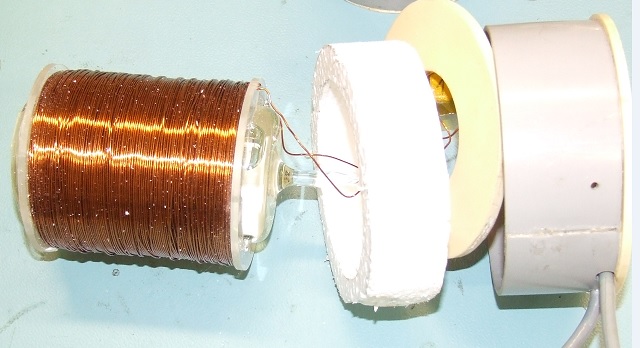
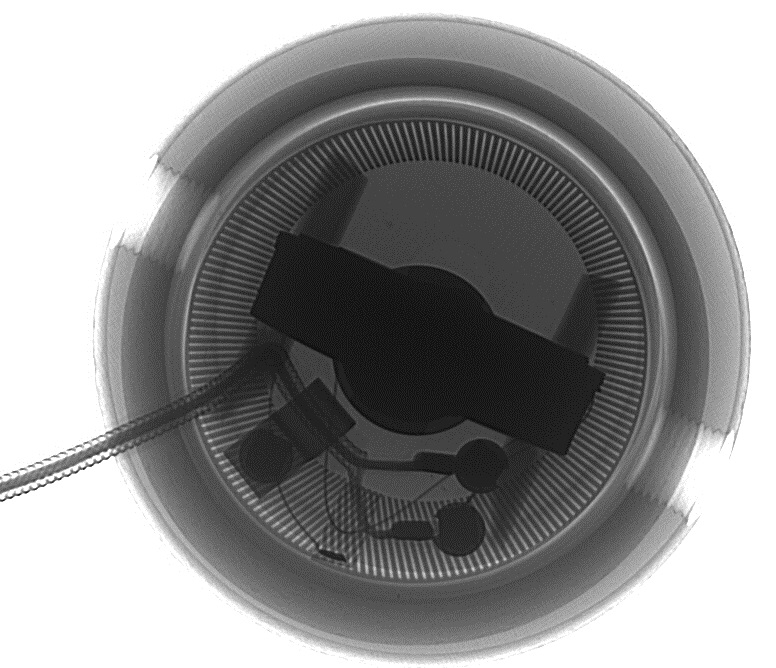
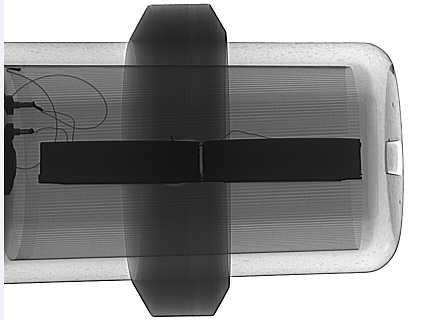
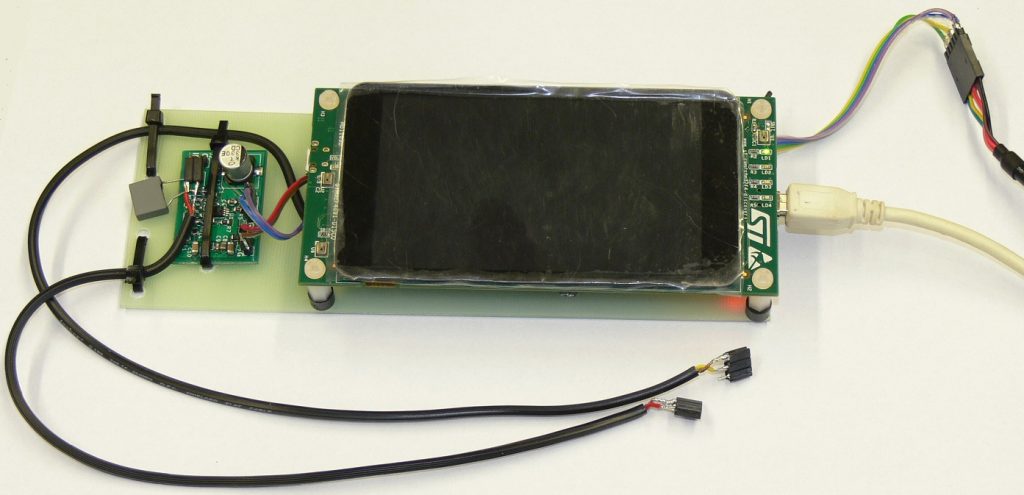
7) At our faculty we have a facility called “laboratories for development and realization” where they have a nice X-ray machine for diagnostics of PCBs and other things… They took a picture of the PM-2 sensor. One can see that the two coils inside are quite thin and probably thanks to this, the sensor can accept more gradient field…
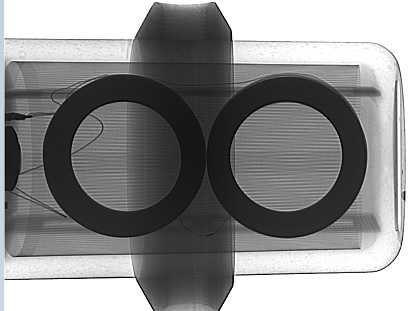
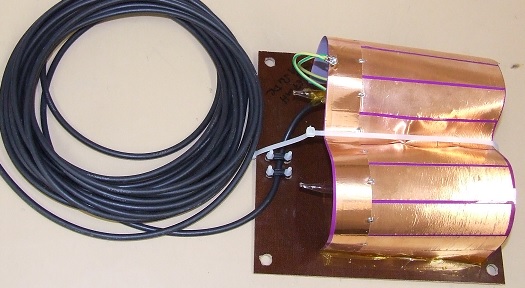
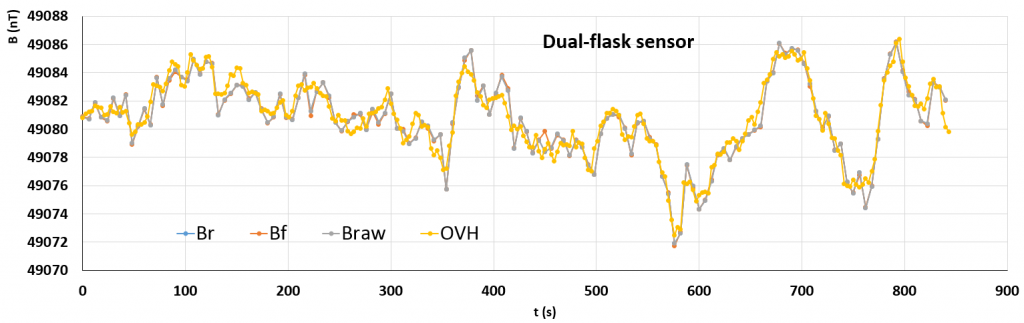
8) Modification of the dual flask sensor – two rather thin circular coils instead of long, large solenoids – works pretty well. The signal is a bit weaker than for the PM-2 sensor (Acetone vs. Kerosene liquid in PM-2). Acetone should provide longer fall time but as we want fast cycling, the kerosene is probably more convenient. Improvised capacitive shielding was also useful.
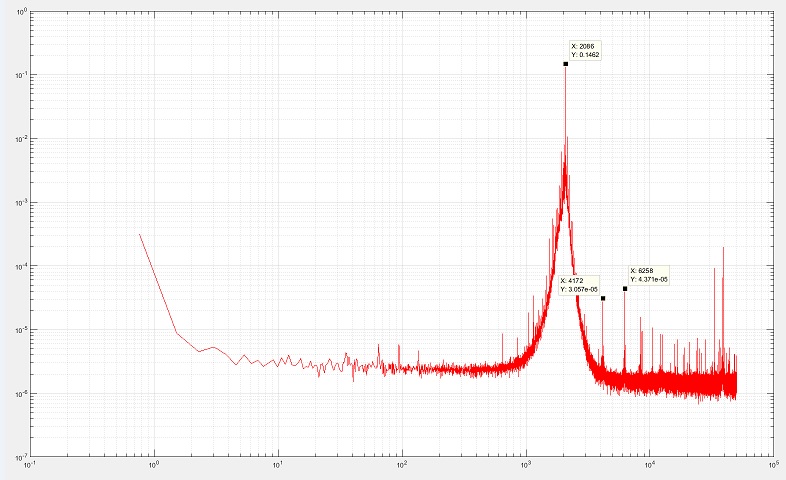
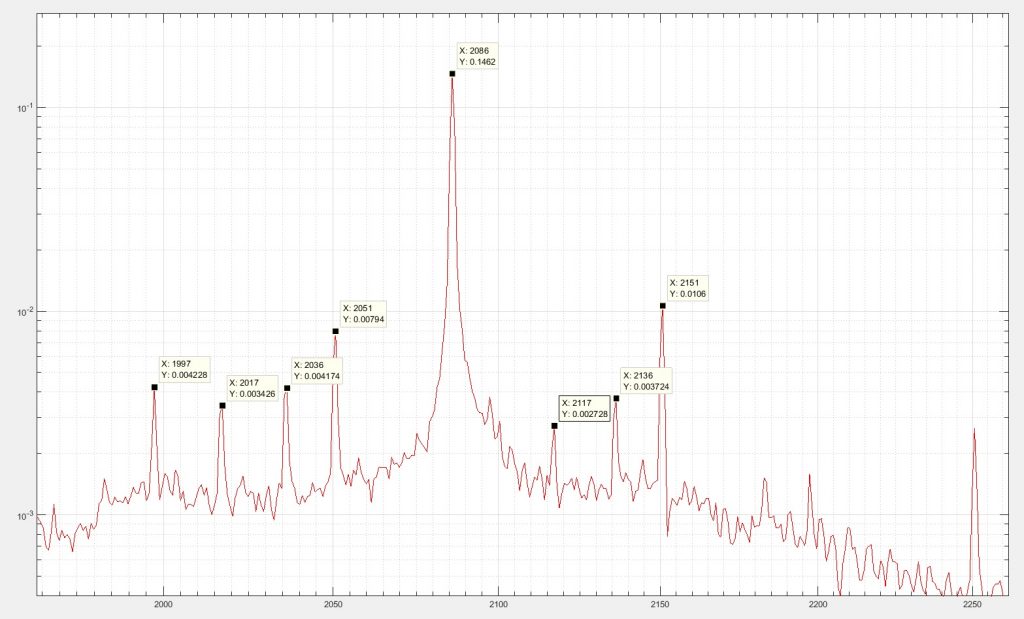
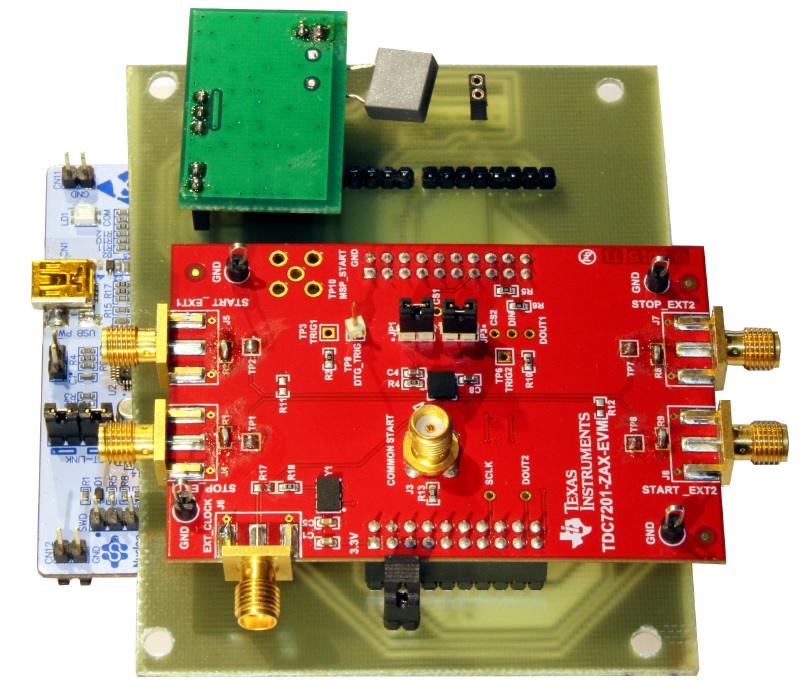
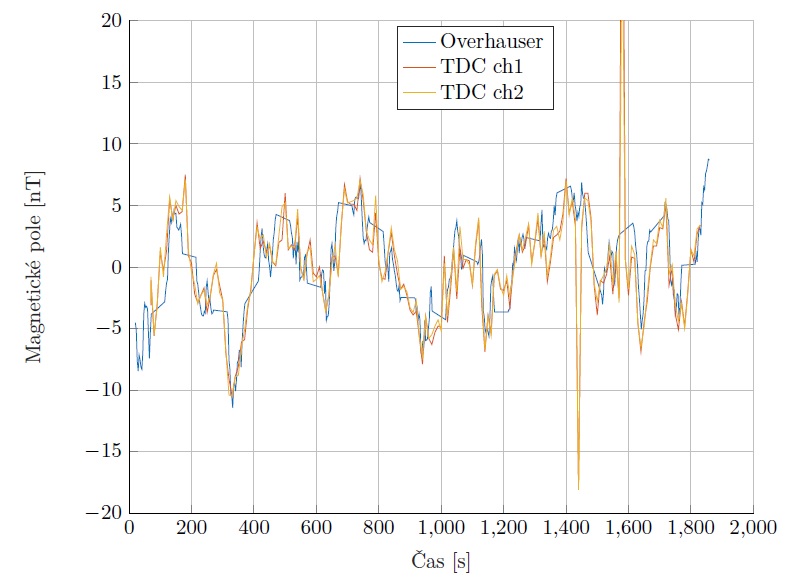
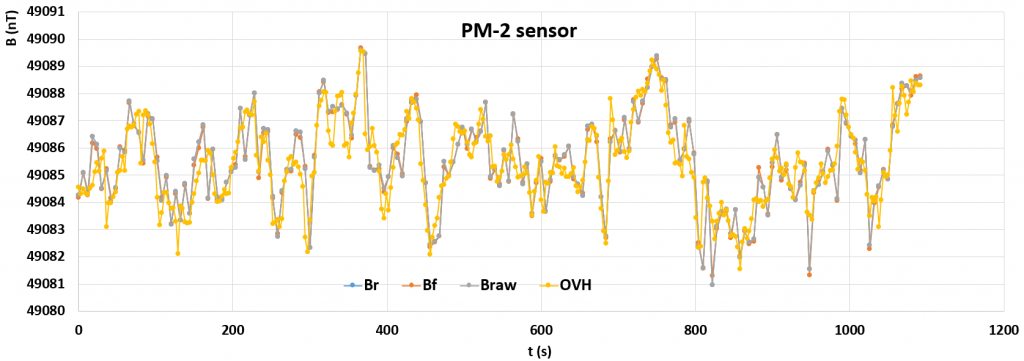
9) In the scope of a bachelor thesis we measured the frequency of the PPS with TDC7201 – “Time-to-Digital Converter for Time-of-Flight Applications” by Texas Instruments. We bought the kit with TDC7201 as the IC comes in BGA package which we are not able to solder directly in our lab… The results are quite nice when compared with a log from a commercial Overhauser magnetometer (Gemsys GSM-19). We measured both rising and falling edge using the two independent channels embedded in the TDC7201.
10) In the scope of a Master thesis dealing with a completely different topic – Curie temperature measurement (but there is a one common point – measurement of frequency) we want to test a frequency measurement with STM32 using its input capture unit of a 16-bit timer (running at 180 MHz) and compare it with the TDC7201 solution (where the STM32 was also used to control the TDC7201)
OK, it took some time to prepare the new frequency measurement setup, I had to do it by myself, the student was not enthusiastic enough…, below are the results and some notes…
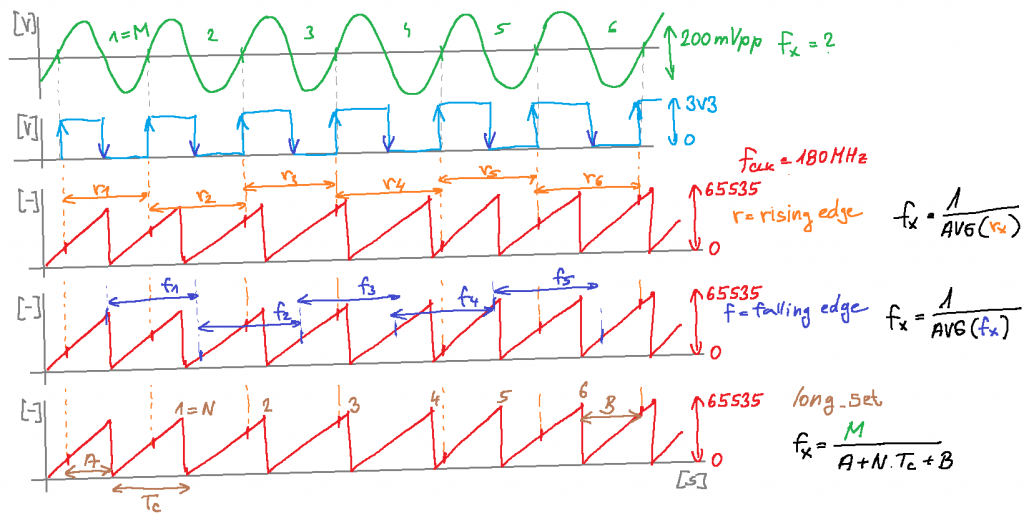
How it works – it uses STM32F469 Discovery board which was resting in my cabinet – this specific MCU (and also the kit..) has a lot of nice features but only a single timer (TIM) is used. It is a 16-bit counter driven by internal 180 MHz clock. Two input capture channels are used, first sensitive to rising edge, the second driven by falling edge of the signal (output of the comparator)… The timer is free running (0,1,2…65535,0,1,2,3…) and in the case of the capture event its current value is copied into specific register and an interrupt flag is set. During some measurement interval (1.2 second in this case) all the edges of the input signal were sampled and stored in a buffer. Finally the values were used to calculate the frequency . B_r was calculated using all the rising edge capture values, B_f using the falling edge values – basically it is an average of all the frequency values given by the difference of two subsequent rising or falling edges… There is a small complicacy – the timer overflows between the edges for 2000 Hz signal, but it is easy to overcome this. B_longset was calculated using only the first and last capture values. See the chart below. The literature suggest that the first approach using all the edges should be more accurate but the results shown below does not really support this – the three values are virtually the same. There was no difference also when the setup was driven by a precise arbitrary function generator, in this case 1 mHz accuracy and 0.1 mHz resolution seemed to be easily achievable. Maybe it could be different with better sensor/signal processing circuit and thus higher SNR.
The first real testing was done at our measurement site located in Pruhonice village close to Prague. There is a lot of disturbances nearby so the magnetic field can easily change in the range of 5-25 nTpp during couple of seconds. Basically it worked nicely, see graphs below. The reference OVH (GSM-19) was placed approximately 10 meters away. There was some small offset (like 10 nT) which was subtracted to show the match between the instruments.
The second testing was done in the countryside of South Bohemia, faraway from the big sources of magnetic field disturbance (subway, trams, DC railway traction…) . First measurements were done in the area of the local Geomagnetic observatory in Budkov, but some strange disturbances influenced the measurements – the proton magnetometer LC tank or signal conditioning got somehow excited, there were narrow pulses every 1.42 seconds which negatively influenced the frequency measurements. The source is under investigation…
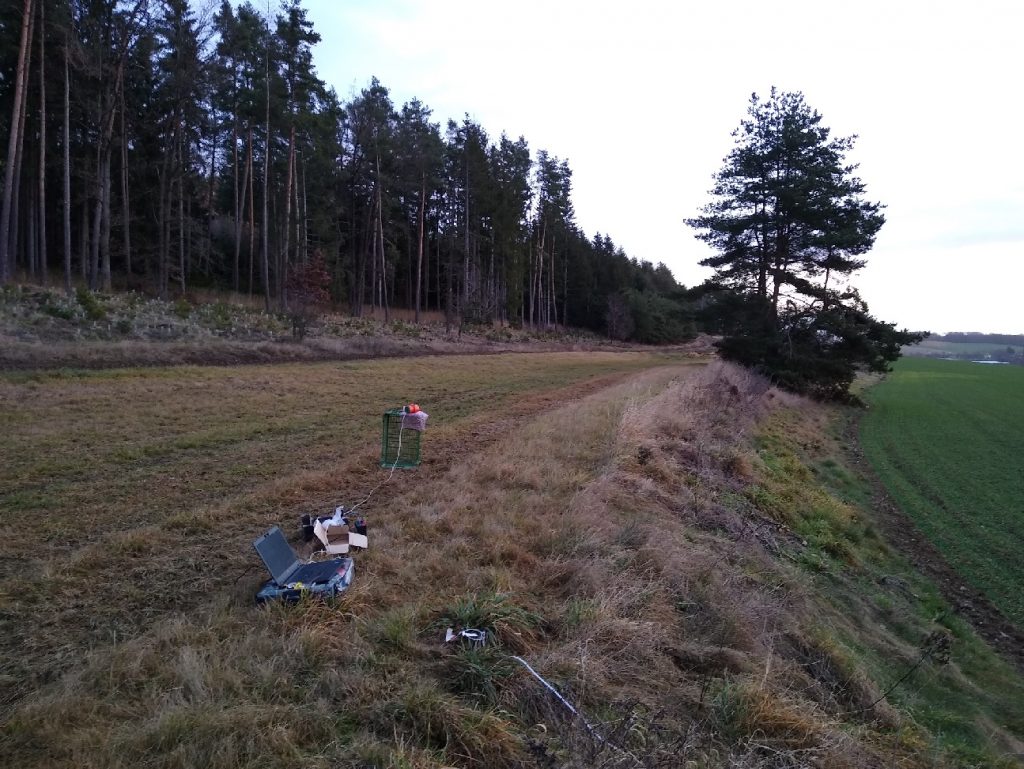
So I took the setup to the forest. There, the results were much better, but some human based influences were still observed, see below.
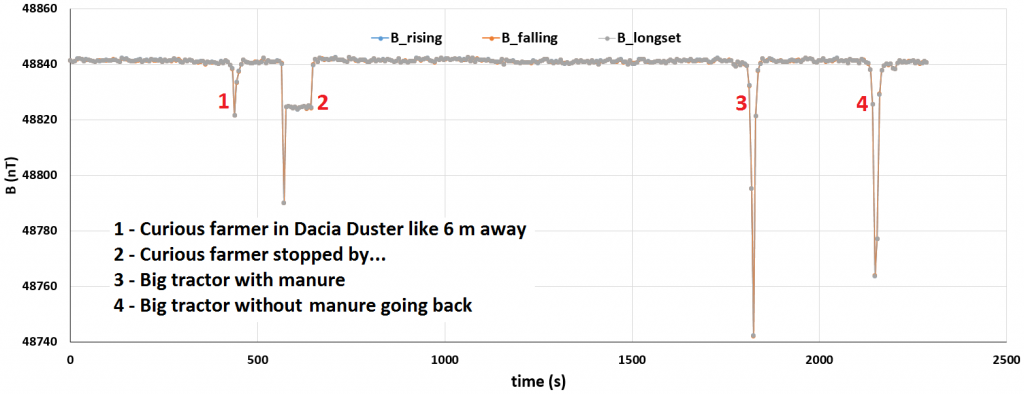
The graph suggests that the manure was magnetic, but actually the tractor just drove a bit further from the sensor at the meadow 🙂
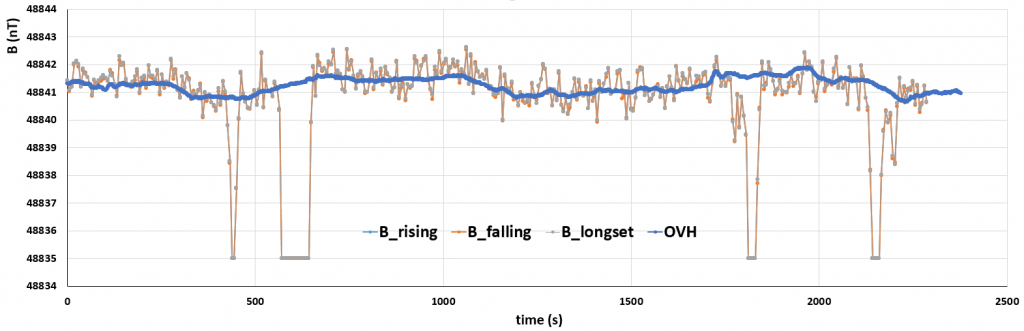
The peak-to-peak noise is 1-2 nT which is quite comparable to values presented here: http://www.alexmumm.de/pgProtonMagnetometer_en.htm
Sometime next time – test different measurement periods, probably completely solid state switching of the excitation/signal pick-up phase and a test of lower noise amplifier…